You are using an out of date browser. It may not display this or other websites correctly.
You should upgrade or use an alternative browser.
You should upgrade or use an alternative browser.
Execel make isometric graph? See picture
- Thread starter BigD
- Start date
Hi Hui,
Thank you for the prompt reply. Here is my data:
One graph (current): Quadrant I: 34.3 ; Quadrant II: 14 ; Quadrant III: 22.8 Quadrant IV: 29.2
One graph (future): Quadrant I: 27.8 ; Quadrant II: 6.7 ; Quadrant III: 30.8 Quadrant IV: 34.7
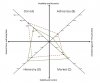
All the graph is basically a normal axis grahy (x and y) rotated so the plots will be each quadrant. The sample chart the picture I posted above.
Thank you again,
Cheers
Thank you for the prompt reply. Here is my data:
One graph (current): Quadrant I: 34.3 ; Quadrant II: 14 ; Quadrant III: 22.8 Quadrant IV: 29.2
One graph (future): Quadrant I: 27.8 ; Quadrant II: 6.7 ; Quadrant III: 30.8 Quadrant IV: 34.7
All the graph is basically a normal axis grahy (x and y) rotated so the plots will be each quadrant. The sample chart the picture I posted above.
Thank you again,
Cheers
NARAYANK991
Excel Ninja
Hi Dustin ,
In your worksheet , select the range of values in B15:B32 , and put in the custom format #0;#0
This displays the negative values without the minus "-" sign.
Narayan
In your worksheet , select the range of values in B15:B32 , and put in the custom format #0;#0
This displays the negative values without the minus "-" sign.
Narayan
This worked exactly how I asked; however, it is not taking the "-" signs off the graph. I changed F15:F32 and the negatives signs still appear on the graph.
Thank you for the input though.
I hope all is well. I have a possible project coming up modifying our scheduling spreadsheets that I may reach out to you for help.
Thanks again,
Dustin
Thank you for the input though.
I hope all is well. I have a possible project coming up modifying our scheduling spreadsheets that I may reach out to you for help.
Thanks again,
Dustin
Last edited: