• Hi All

    Please note that at the Chandoo.org Forums there is Zero Tolerance to Spam

    Post Spam and you Will Be Deleted as a User

    Hui...

  • When starting a new post, to receive a quicker and more targeted answer, Please include a sample file in the initial post.

Excel chart leaving blank space at top & bottom of plot area

Ria

Member
I am using Excel 2007. I have scattered line chart connected with scroll bar.

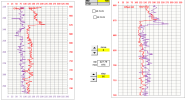
In plot area, it shows gaps/blank space at top and bottom (BLUE ARROW). There is data above and below the plotted line.

I checked my data, start to end there is no blank /empty cells.

I tried all options from Hidden and Empty Cell Settings. Nothing works.

Please can anyone know how to blank space from plot area. Attached excel file. Also screen shots in word file.
1704673805545.png
1704673815906.png
 

Attachments

  • HELP FILE.xlsx
    453.6 KB · Views: 1

Ria

Left side axes scale is automatic 525 ... 555
Right side axes scale is automatic 730 ... 760
Top horizontal axes scale is 0.0 ... 150.
If You'll make some modifications to those ... then it could look like below.
Screenshot 2024-01-08 at 09.56.22.png
You could find min & max -values for those.
 
Thanks for reply. I can't produce same results.
Left side axes scale is automatic 525 ... 555 ====THIS IS DYNAMIC VALUES CHANGES WITH SCROLL BAR
Right side axes scale is automatic 730 ... 760 =======THIS IS DYNAMIC VALUES CHANGES WITH SCROLL BAR
Top horizontal axes scale is 0.0 ... 150. ===THIS WILL STAY CONSTANT BECAUSE MY DATA RANGE FALL IN THIS RANGE.
Any other thought please?
 

Ria

Manually ... You could do something like this >> modify both vertical Major Units to 1
Your horizontal axes scale should be different >> find out min and max values >> to see all data

If You would like to have less spaces,
then You should use code (VBA) to modify those vertical scales match better ( = not automatic )
... because now, Excel will set those as ... Excel will set.
 

Attachments

  • HELP FILE.xlsx
    402.9 KB · Views: 1

Ria

I tested to do a sample how to avoid those spaces ...
as well as Your other thread's dynamic excel chart with scrollbar

... I used spinbuttons for those, which are left side of chart.
> You could scroll both whole datas with one spinbutton with less spaces <
Screenshot 2024-01-09 at 18.36.57.png
 

Attachments

  • HELP FILE.xlsb
    195.4 KB · Views: 1

Ria

I tested to do a sample how to avoid those spaces ...
as well as Your other thread's dynamic excel chart with scrollbar

... I used spinbuttons for those, which are left side of chart.
> You could scroll both whole datas with one spinbutton with less spaces <
View attachment 86136
Thanks for looking at it. I will try to use spin buttons instead if that will skip all blank spaces. It is making me crazy. Even ChatGPT could not suggest proper solution. I am not concerned with horizontal values display but vertical values display is matter.
 

Ria

Are those horizontal values correct way in my sample?
... below left sid chart
I tested those this way ... but of course those could be other way too.
... something like right side chart ( related with C & H-column values )
... ... then those both datas can show in one axes and the result will look ... different than in left chart.
Screenshot 2024-01-10 at 11.25.37.png
It's not matter to use spin buttons or as You've tried to use - it matters - the way to use those controls.
... that would be a challenge with Your way ... or with ChatGPT.
 

Ria

Are those horizontal values correct way in my sample?
... below left sid chart
I tested those this way ... but of course those could be other way too.
... something like right side chart ( related with C & H-column values )
... ... then those both datas can show in one axes and the result will look ... different than in left chart.
View attachment 86149
It's not matter to use spin buttons or as You've tried to use - it matters - the way to use those controls.
... that would be a challenge with Your way ... or with ChatGPT.
Thanks a lot. I will to produce same results. If I can then mystery solved.
 

Ria

I tested to do a sample how to avoid those spaces ...
as well as Your other thread's dynamic excel chart with scrollbar

... I used spinbuttons for those, which are left side of chart.
> You could scroll both whole datas with one spinbutton with less spaces <
View attachment 86136
Excel 2007, I have dynamic line chart connected with scrollbar and dynamic named ranges are connected with chart and scrollbar. Plot area leaving gaps at top and below. I am struggling with this display issue and got crazy now. To fix it, with some help I got a vba code that works but 2 issues.

  • I have my defined ranged name: I want to use range in this code ( currently code using dummy)
  • Name: TVD_cw
  • Refer to: OFFSET(Gamma!$C$2,WPTest!$BG$1+1,0,WPTest!$BG$2,1)
  • When I run this code, excel chart still leave gaps at top and bottom
Would please someone help. Any alternate solution. I am deadly tired with this isse.

Here is the code:

Code:
Sub AdjustChartScales () 'WORKS BUT STILL LEAVE GAPS ON CHART
Dim wsChart As Worksheet
Dim wsData As Worksheet
Dim chartObj As chartObject
Dim axis As axis
Dim rngTVD As Range
Dim namedRange As Name

' Set the worksheet containing the chart
Set wsChart = ThisWorkbook.Sheets("WPTest") ' Change to your actual sheet name

' Set the worksheet containing the data
Set wsData = ThisWorkbook.Sheets("Gamma") ' Change to your actual sheet name

' Set the chart object
Set chartObj = wsChart.ChartObjects("Chart 15") ' Change to your actual chart name

' Set the Y-axis
Set axis = chartObj.Chart.Axes(xlValue)

' Find the last non-empty cell in column C on the data sheet
Dim lastRow As Long
lastRow = wsData.Cells(wsData.Rows.Count, "G").End(xlUp).Row

' Check if there is data in column C
If lastRow >= 2 Then

' Set the dynamic range from C2 to the last non-empty cell in column C on the data sheet
Set rngTVD = wsData.Range("G1:G" & lastRow)

' Create a dynamic named range for the Y values
Set namedRange = wsData.Names.Add(Name:="TVD_cw", RefersTo:=rngTVD)

' Assign the named range to the chart series
chartObj.Chart.SeriesCollection(1).Values = "='Gamma'!" & namedRange.Name

' Set the axis scales to match the data
axis.MinimumScale = WorksheetFunction.Min(rngTVD)
axis.MaximumScale = WorksheetFunction.Max(rngTVD)
Else
MsgBox "Error: No data in column C on the data sheet.", vbExclamation
End If
End Sub
 

Ria

Use whole data
Control only scale for view (Worksheet_Activate & Do_It_2).
Something like this samples right side chart.
 

Attachments

  • HELP FILE.xlsb
    305.6 KB · Views: 4

Ria

Use whole data
Control only scale for view (Worksheet_Activate & Do_It_2).
Something like this samples right side chart.
Thanks a lot man. You saved my life. It looks the way I wanted.
This code should work with range names and scrollbar, I will give a try.
 
Thanks a lot man. You saved my life. It looks the way I wanted.
This code should work with range names and scrollbar, I will give a try.

Ria

Use whole data
Control only scale for view (Worksheet_Activate & Do_It_2).
Something like this samples right side chart.
Solution you provided works like magic. One more question related to your solution. Step =30 is display on chart and Move = current position of scroll. When I click on scrollbar, chart changes the display with multiple of 30. (for example it shows: 1 to 30, when I click on scrollbar once , it will show 30 to 60). That is fine. Is there a way to do some overlap from previous view to next ( for example click on scroll should display 25 to 55 vs 30 to 60). In this case user is not loosing view completely but will have overlap/transition from previous view.). Please help me how to do it. I am bound to use scrollbar and need to stay with scroll (vs. spin button). I have beginner level knowledge and learning as needed.
Thanks.
 

Ria

Use whole data
Control only scale for view (Worksheet_Activate & Do_It_2).
Something like this samples right side chart.
Hey BOSS: I need help in excel/VBA charts. I AM STILL STRUGGLING. It is continuation of the previous work you helped. I thought it is good to ask you because you know this topic very well.

From your work I learned and try to improve my end file but still have issue that I can’t figure out and need expert help. Please keep code simple so I can modify if I need. I spent lots of time on it and burnt my mind. To refresh you, here is overview what I need:

  • I have 2 excel charts/line charts (connected with 2 vertical scrollbars; one for each).
  • Left scrollbar is for left chart and right scrollbar for right side chart.
  • Chart 1/left side has only one axis, however chart 2/right side has primary & secondary axis.
  • Chart 1 has only one line and chart 2 has 2 lines.
  • Chart 1 data is secondary axis for chart 2. This is to compare the data.
  • Both charts display range is depth in meters, and increases as we scroll down and decrease on up scroll.
  • Display range on charts (min & max) should be multiple of 5
  • Min & max of all data should be converted to multiple of 5 (if already not multiple of 5)
  • On both charts: Major units: 5 & minor units: 1
  • Major and minor units on both charts should line up.
  • Same on chart 2: primary & secondary axis: Major & Minor units must line up
  • Here I am struggling: Major & minor units on both charts do not line up. Same on chart 2; major & minor units for primary & secondary axis do not line up. If they line up and we get new data or scrolling up /down mess up the alignment.
  • Actually it mess up display range and then major & minor units’ alignment messes up.
  • Sometime when someone drag the scroll (within scroll arrows) mess up the alignment.
I want to control scrollbars, in following way:

Cell link: AP 11

Min value: AP12 è get from data range

Max value: AP13 è get from data range

Current scroll value: save in active sheet cell: AP14 (calculate & assign to scroll & save in cell)

Incremental change read from cell: AP15 è User will enter as per need

Page change value read from cell: AP16 è User will enter as per need

Display range on chart: AP17 è User will enter as per need

I want to send my file but after deleting extra data file size is big and can’t upload here. Now sending your last file.

I your code: for scrollbars initial value:

v_SBarL = Int((yy_min + yy_max) / (5 * rr)) * rr
v_SBarR = Int(h_max / rr) * rr + rr

Why is formula different for both scrollbars, can it be same for both. What is the 5 and RR in formula, please explain if you can.

What is SS in following code:

ss = 25
With .ChartObjects("Chart_2").Chart
With .Axes(xlCategory, xlPrimary)
.MaximumScale = Int(xx_max / ss) * ss + ss

I need only help for vertical scrollbars. You can delete code for horizontal scrollbars, it is confusing me.
dd.png
 

Attachments

  • HELP FILE_APR.xlsb
    237.7 KB · Views: 0
There is newer my file (Feb 8, 2024) than You sent.
Why do You want to do those manually settings?
Your I want to control scrollbars, in following way
... means that You want to start from same situation as Jan 8, 2024 ... why?
... ... without overlapping and so!
Your Why is formula different for both scrollbars...
... if I remember correct ... because someone skipped to tell me - what needs?
Your 25
... one possible way to make sure that there could be usable scale.
You seems to skipped my the latest version ... totally?
... You even comment it: Awesome. We are ok if more then 2 axis are readable only. Hats off.
I am sorry. Last 2 of your sheets were password protected so do not know what was the code. I had to work on different project, now came back and have these questions. I am using the code that I can understand and use that's why have problems.
Is there a way in vba, we can lock scrollbar (so no one can drag within scroll between arrows or set it a value e.g. same value as incremental change or page change?
 
You still write as You've written ... no answers.
Did You read Your previous writings the last side sentence?
I see - You have skipped all my codes ... all my helps to do Your tasks with that ... hmm?
ScrollBar - There is an option .Locked - which default value seems to be True.
 
Back
Top