luiscoutinho
New Member
Hi there,
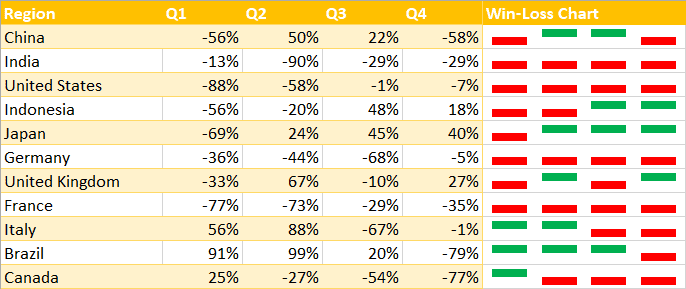
I would like to do a chart, a win/loss chart, comparing the amount ordered the day before with the amount produced at the date.
I have the data since January 2019, day by day, and I would like that the chart shows 10, 15 days, and I have a scroll bar to move xx axis along the time.
Can someone help with an example
Thanks in advance