L llozer New Member Aug 31, 2014 #1 Hi all! Please, anybody know how to create this graph in excell 2010? Attachments image.jpg 48.1 KB · Views: 12 Last edited: Aug 31, 2014
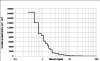
N NARAYANK991 Excel Ninja Aug 31, 2014 #2 Hi , See this file ; the chart is an X-Y scatter chart , and the X-axis is to logarithmic scale. Narayan Attachments Book1.xlsx Book1.xlsx 11 KB · Views: 14
Hi , See this file ; the chart is an X-Y scatter chart , and the X-axis is to logarithmic scale. Narayan