• Hi All

    Please note that at the Chandoo.org Forums there is Zero Tolerance to Spam

    Post Spam and you Will Be Deleted as a User

    Hui...

  • When starting a new post, to receive a quicker and more targeted answer, Please include a sample file in the initial post.

Gantt Chart

DirkT

New Member
Hi. I found Gantt chart templates in excel and online that use the dates with conditional formatting to display these time periods as bars in the respective rows. I want to do the reverse. I would like to indicate cells in the specific row that will represent this time period. Excel must then recognize what dates are indicated and update the start and end date. Just I indicated with the red arrows below. Has anyone seen a solution for this problem? Thank you. Dirk
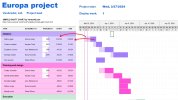
Gantt1.jpg

Gantt2.jpg
 
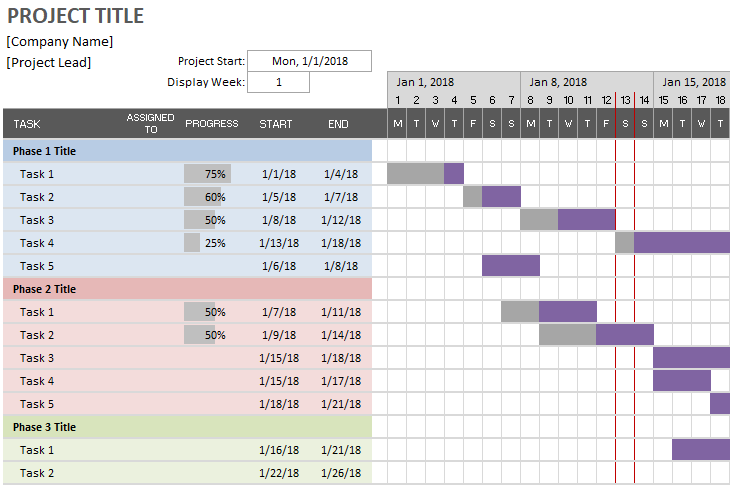
most gantt charts use the start and end dates
i have a few that i uses
not sure what this template is doing without actually seeing the details ,as it has various colours -
so I suspect 2 conditional formatting rules , one which also uses the % -
Since when NO % added - it seems to do what you want , last 3 rows

maybe a link to the template would help

doesnt the planning and design section without a % filled in - so the last 3 rows - do what you want

Hi. Thanks for the help. For now I found that Monday.com works perfectly without the need to pay for a subscription for what I want to do.

Like I mentioned, Excel must recognize what dates are indicated and update the start and end date. Thus I want to draw the bars to the right and that should update the start and end dates. I might use this in the future, or not.

Find the link and file attached as requested.
 

Attachments

  • Simple Gantt chart1.xlsx
    41 KB · Views: 4
ok,
EDIT -
Thus I want to draw the bars to the right and that should update the start and end dates.
OH ok,
NO i dont know how to do that with a function

if you just fill a cell with a colour - then as far as I know a function cannot see that colour and then use the date -

It will probably need VBA to do that - find the start of the colour fill and then lookup the date as a start date - then see where the fill colour stops and lookup the date from that column

sorry - misunderstood what you needed

It would be useful to know what version of excel you want this to work with

so i have removed ALL the conditional formatting rules - that was based on the % complete
so now you have a bar on the right based on start and end dates
and removed the formulas used in the start and end dates - ALL formulas for the dates
added just a few so you can see

now you can put any dates in you like and the formulas are not dependant on previous formulas or the project start date

is that what you meant .....
 

Attachments

  • Simple Gantt chart1-ETAF (1).xlsx
    40.9 KB · Views: 2
Last edited:
Have a look at the Gantt chart on Monday.com. I want excel to do the same.
I want to draw the bars to the right and that should update the start and end dates on the left.

I don't need this function in excel at the moment so I really appreciate your help for now.

Regards
 
i have edited my post , just before you replied, as i just reread and see what you want ,
I dont know how to do that
 

DirkT

Could this sample work someway as You've thought?
# Select cell
# Mark cells (~bars) with colors (which are very sensitive)
# Move Your mouse somewhere
% and dates should update
 

Attachments

  • Simple Gantt chart1.xlsb
    44.8 KB · Views: 3

DirkT

Okay...
Few minor notes ...
# it's very sensitive with those colors
# dates will refresh after You've moved cursor
# Display week ... changes calendar ... project itself stays in same place (~move)
# I added [ ReFresh All ]-option to refresh all rows (8... 31)
# So far Insert new rows ABOVE this one-option won't work

# Of course, it could be possible to modify dates & progress and after that refresh chart (This needs coding).
> Updated file.
 

Attachments

  • Simple Gantt chart1.xlsb
    44.2 KB · Views: 4
Oh wow, you managed to make it work, thanks, well done!

I am only interested to work from right to left, so that the start and end dates get updated from the movement of the colored blocks, just like you have it now. Don't yet understand what you mean with insert new row problem, I will use it and see where it needs changes.

Where and how did you set it up like this, is it coding or a macro, I would just like to see it and learn something new..

Thanks!
 

DirkT

I've tested it few times ... there could be some unwanted features.
My writing Insert new rows ABOVE this one-option won't work
-- means -- it won't work - because this sample uses fixed range.
BUT
This sample could have new rows-option
... I skipped to test it, but You'll test it.

There are some code for those.
 

Attachments

  • Simple Gantt chart1.xlsb
    46.6 KB · Views: 5

DirkT

If You've tested above file or any of those files ...
You've noticed that there should do some 'minor' modifications ... like below:
Screenshot 2024-03-30 at 18.26.06.png
Please ask, if You'll have questions - eg how to use it?
I've done some tests with it - there could be some unwanted features ...
Now, most of those sample files task's start & end dates ... cannot be realistic, if progress's are as given.
 

Attachments

  • Simple Gantt chart1.xlsb
    59.6 KB · Views: 0
Last edited:
Back
Top