Dheeraj0501
New Member
Hi all,
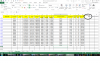
I have a pivot table data containing truck numbers and their trips per day. This is data is displayed as performance bar graph in next sheet for particular date selection range(start and end date between which trips are counted).
Now I would like to add remarks column in pivot data.
Please suggest some way to display this remark near graph on selection of truck number and date.( like trips 0 -- breakdown,3 -- raining etc....remarks also vary because large numbers of users)
Thanks in advance
Regards
Dheeraj