• Hi All

    Please note that at the Chandoo.org Forums there is Zero Tolerance to Spam

    Post Spam and you Will Be Deleted as a User

    Hui...

  • When starting a new post, to receive a quicker and more targeted answer, Please include a sample file in the initial post.

copy data within two blank rows

ibrahim

New Member
Hi!
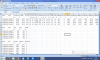
I have data sheet with headers in two rows then follows the data upto 93coloums. After 93RD coloums again i get the data with two headers. Number of rows vary from sheets. I need to plot graph from these data.
Please help me as I'm in macro for excel.
Format as below

Date Time A B C D ......CW
z y x...............
16.6 2.10 1 2.................
16.6 2.11 1 2 .................
.
.
.
end
Blank rows
Date Time A B C D ......CW
z y x...............
16.6 2.10 1 2.................
16.6 2.11 1 2 .................
.
.
.
 
Ibrahim

Firstly, Welcome to the Chandoo.org Forums

Can you please post a sample file with some data
 
From this is is unclear what you want charted
There is only 5 columns, not 93 you refer to
There is no repetition in data from the first 6 row block to the second 6 rows

1. Your dates are text, Use Data, Text to Columns and convert them to Dates
2. Your times are text, Use =timevalue(cell) to convert them to times
3. Add a spare column where you add the dates and times together
4. Add a Chart and use the combined Date/Times as the X Axis and what ever data you want for the Y axis

I suspect your data layout is a lot more complex than the file you attached?
 
Hello Hui!
You are right. My data file size much bigger hence i just copied some sample data for smaller file size. But the format is similar to the test file except that i have min 3 block of rows and 93 coloumns with data

I have to plot graph from every sheet of data for various selected columns.I am thinking of macro to do that. But the problem is that the no. of rows varies in different sheets. So i need to find the way to select the data within two blank rows.

Any help is highly appreciated. Thanks in advance.
 
Hello Hui!
Please find the screen shot successfully uploaded.
my requirement is
1) one graph to from each set of rows which begin with the Date in col A
2) the end of row set varies from sheet1 to sheet2.
ie., Sheet1 Rowset1 is a1...a361 , rowset2 is a363...a723 and rowset3 is a725..a800
Sheet2 could be Rowset1 is a1...a200 , rowset2 is a202..a400 and so on.

Now selecting the rowset2 is becoming difficult in my macro.

Thanks in advance.


3) but
 

Attachments

  • Untitled.png
    Untitled.png
    129.1 KB · Views: 4
Can you please upload or snail me a whole file
Save it as a *.xlsb file type to save space
 
Thanx Ibrahim

Av few questions

This data if for the 20th June
Is there a new set of data each day?
Do you want the time plotted on the X Axis?

Which fields do you want to plot or do you want to plot them all or be able to select the fields?
 
Hi Hui!,
Yes I may get data sheet for every day. time on x axis. and i should be to select the fields for which i think i will use named ranges and fixed chart in my template sheet.
 
HI Hui,
I found on net that the LEN command can be used for finding blank cells. please guide how to use that in my requirement
 
Back
Top